 Soil Nutrient Management
SOIL 4234

Soil Nutrient Management
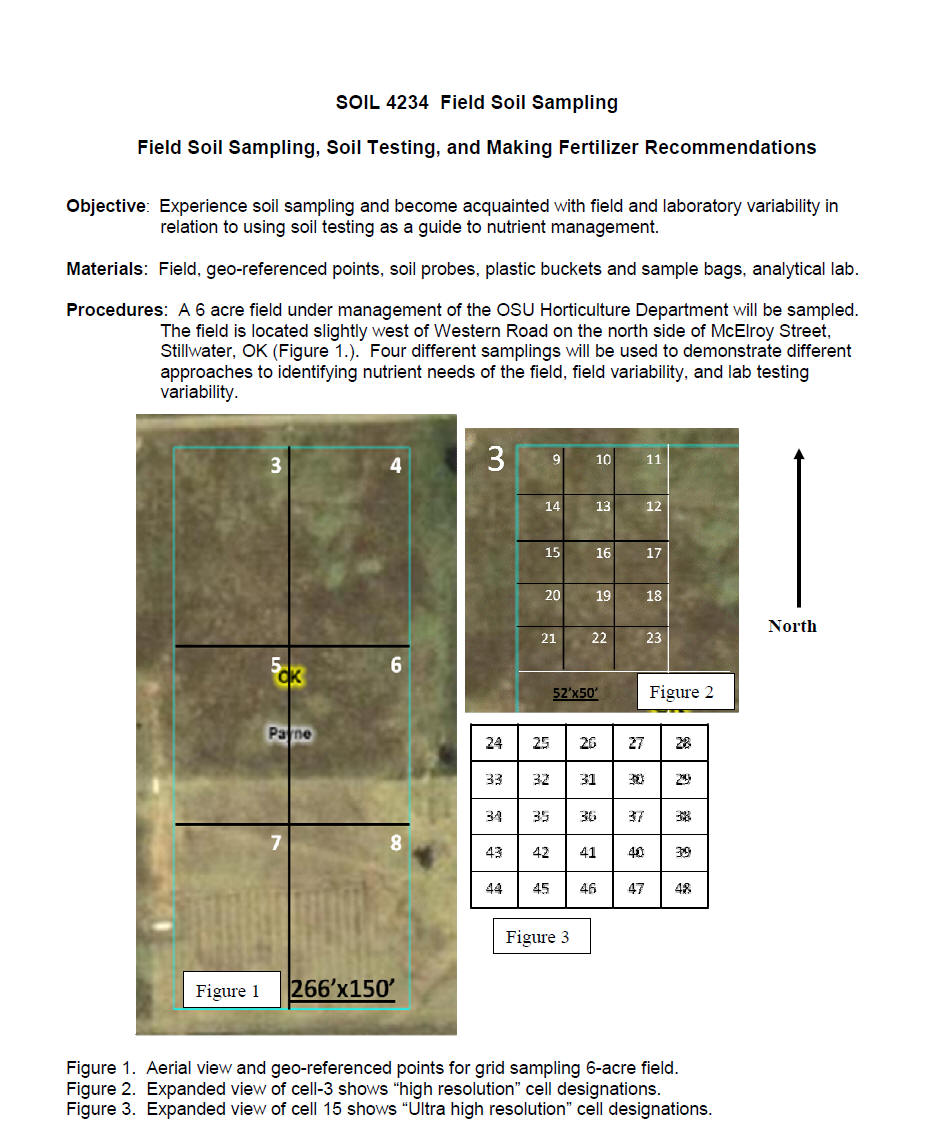
Field Soil Sampling
2010 Handout and Results section
Word
2010 Soil Sample Results
EXCEL
CLICK HERE FOR ONLINE
SOIL HANBOOK !!!!!!!!
Results and Report:
Link to 2005 Results.
Assignment
Hint:
For Tables 2 and 3 for min, max, average recommendations use the
use soil test calculated values given, not average of vertical or by plot
recommendations.
SOIL TEST RESULTS
1. Random sampling of the entire field.
Results of entire field random sampling, and
splitting the random sample into two separate samples are given in Table 1.
Table 1. Soil test
results* for composite samples from random sampling of entire field.
*Units are lb per acre for N and ton per acre for ECCE lime. Other values are indexes.
2. Grid-cell sampling.
Results of sampling 24 individual cells, after obtaining a composite of 15 cores randomly taken from the entire area of each cell, are given in Table 2.
Table 2. Soil test results* for composite samples of each 1-acre cell
*Soil test units are lb/acre for N and indexes for other measures. Requirements are ton per acre for ECCE lime and lb/acre for N, P2O5, and K2O.
3. High resolution.
Results of sampling 25 individual cells within the 1-acre cell number 15, are given in Table 3. (40'*40')
Table 3. Soil test results* for composite samples from each of 25 cells within a 1-acre cell.
*Soil test units are lb/acre for N and indexes for other measures. Requirements are ton per acre for ECCE lime and lb/acre for N, P2O5, and K2O.
4. High resolution.
Results of sampling 25 individual cells within the 1/25th -acre cell number 13, are given in Table 4.
Table 4. Soil test results* for composite samples from each of 25 cells within a 1/25th-acre cell.(8'*8')
CALCULATIONS:
1. Random sampling of the entire field.
a. Calculate the average soil test values (complete Table 1) for each pair�s composite sample. This is the average for the two bags of soil that were filled from a single bucket containing at least 15 randomly taken cores.
b. Using the average values you calculated, explain whether there is there more error in the lab (difference between two samples from the same bucket) or among people taking the sample (difference between average results for pair 1 and pair 2)?
c. Would lime and nutrient inputs identified by the soil tests be markedly different using the samples from pair 1 compared to pair 2?
2. Random sampling 1-acre cells.
a. Complete Table 2 by identifying and recording the amounts of lime, N, P2O5 and K2O required to support production of wheat grain, in rotation for a 50 bushel/acre yield goal. Use the web site below to find the lime and nutrient requirements.
http://clay.agr.okstate.edu/extensio/swfal/nutrientdecision/index.html
This is not the link to the handbook. The link is at the begining
of the assigment.
b. Add the amounts of lime, N, P2O5 and K2O required for each cell and record the totals below.
lime ________ tons N ________lb. P2O5 ______ lb. K2O______ lb.
c. Identify the per-acre requirements for the entire field using the average soil test values for the 24 cells and record those values below.
lime ________ tons/acre N ________lb/acre P2O5 ______ lb/acre K2O______ lb/acre
Now multiply these values times 24 to obtain the total field requirement and compare these values to those calculated by totaling requirements for each cell (part 3).
lime ________ tons N ________lb. P2O5 ______ lb. K2O______ lb.
d. Calculate the largest differences between a single rate for the entire field based on average soil test values, and the amount applied to an individual cell based on soil test values for that cell, for each input. Record the amount and cell below.
lime ________ tons (cell_____) N ________lb. (cell_____) P2O5 ______ lb. (cell_____)
K2O______ lb. (cell_____)
e. If the cost of soil testing was not a factor, explain the benefit of treating each cell individually compared to applying an average rate of inputs for the entire field. Consider yield differences and fertilizer and lime costs in your explanation.
3. High resolution.
a. Complete Table 3 by identifying and recording the amounts of lime, N, P2O5 and K2O required to support production of wheat grain, in rotation for a 50 bushel/acre yield goal.
b. Compared to a single rate application based on the results for cell 3 in Table 2., describe the benefit of high-resolution sampling (reference specific data to support your answer)?
Student Group number ____
Members: _____________________ _____________________
_____________________ _____________________ _____________________
